We were delighted to be supporting partners of MCN2021 – it is one of our favorite platforms for connecting with, and hearing from, our peers in the industry.
As expected, this year’s conference looked a bit different with the format remaining virtual and spread over the course of weeks. What was not expected, was the outpouring of emotional, inspiring, and hopeful sessions that were given by our passionate peers in muse-tech. Many of the sessions focused less on the big flashy projects and more on the small wins, or scrappy DIY efforts.
We joined the conversation with a session that reviewed app data from before, during, and after the lockdowns due to the pandemic. Our question was this: Are audiences more ready to use museum apps now, than they were historically in pre-pandemic times?
To get to the root of this question we took a look at data from three very different museums in terms of strategy, location, demographics, and lockdown period. In case you missed the session, here’s a quick recap on what conclusions we were able to draw from three different museums’ data sets.
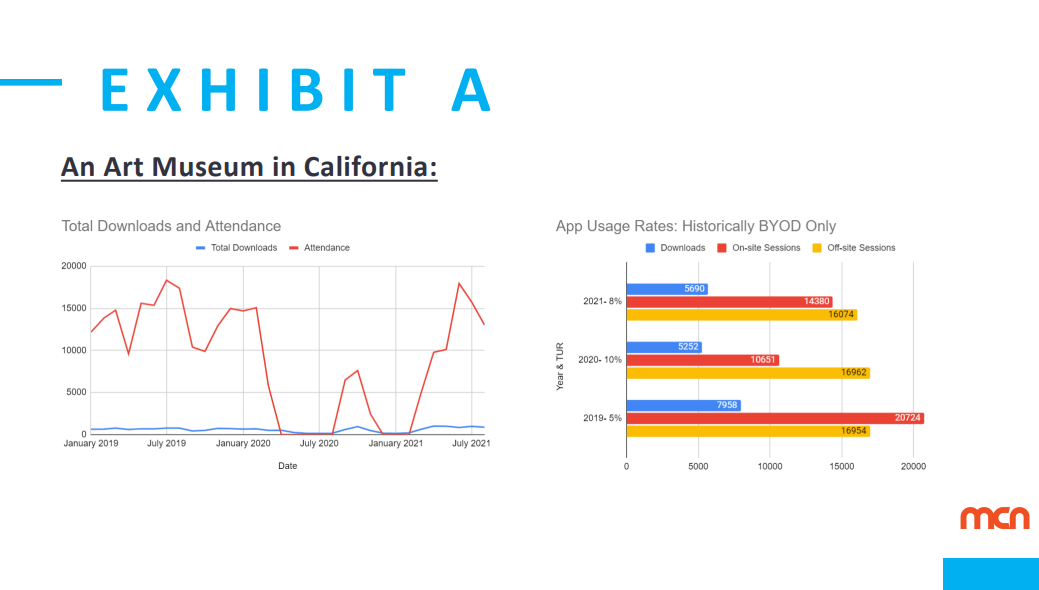
Museum A
The first data example we discussed comes from an institutions that has historically been “BYOD” (bring your own device) only for quite a few years. It was very interesting to see that despite a drastic decrease in attendance, the overall amount of downloads did not decrease at the same rate, resulting in an increase in the download rate (or TUR). As you can see from the graphs on the left, the onsite sessions, also known as app usage while at the museum, drastically decreased in 2020 given the closures and lockdowns. However, the sessions off-site did not drastically change. Despite visitors not having any prospect of getting to museum in-person, they were still using the app and exploring the app’s content. This could be attributed to change in strategy undertaken by the client. We worked with them to bring their AR experiences to the outdoor park where the museum lives, and also added podcast content to the app so there was content available specifically for “arm-chair visitors”.
What is also important to recognize, is that the bar graph from 2021 is incomplete, given the data only shows January-August of 2021. However at this rate, combined with our understanding of their traffic patterns, we expect to see a consistently higher TUR and an overall download rate both onsite and offsite that surpasses all years prior by the end of 2021.
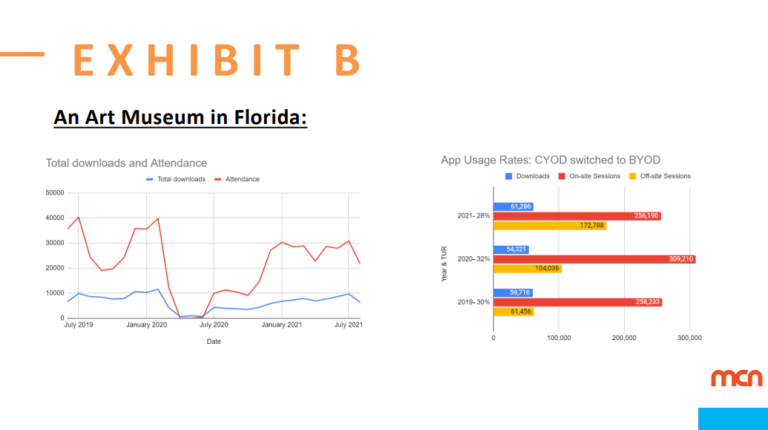
Museum B
The second museum we discussed historically had a “CYOD” (choose your own device) guided experience, with the option for visitors to either download the app, or rent a device with the app predownloaded onsite. When the pandemic hit, this client immediately stopped offering the shared devices for sanitary reasons, and as we can see by the bar graphs the download rates increased dramatically. This museum did not close for as long as the two other examples shown here, but did have lower capacity limits as shown in the attendance data. With downloading the app being the only option for visitors, the take up rate increased, as well as the amount of onsite and offsite sessions. Such as the previous example, the 2021 data here is also incomplete, and given patterns of past data and international tourism reopening, we expect both the overall onsite and offsite download to continue to increase AND the download rate to increase.
The move to a “BYOD” strategy was so successful, that this museum will not longer offer devices onsite in perpetuity.
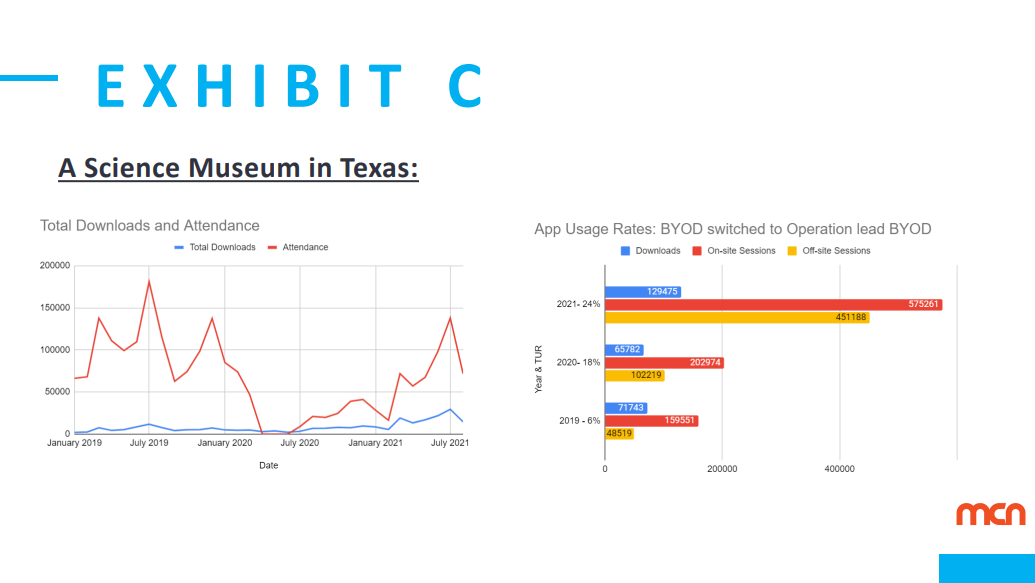
Museum C
The final example we discussed was a science museum that had only recently forgone onsite devices, and was still working through their “BYOD” strategy when the pandemic hit. As you can see from the graphs, their TUR, and overall onsite and offsite session skyrocketed in 2021 compared to 2019. And again, the data set of 2021 is not a complete year. By the end of the year, we expect the number of downloads to have almost tripled compared to 2019. Given the pandemic, this museum rethought the importance of a touchless experience, and situated their app as a true companion guide that is not just integral, but necessary to the onsite experience. They marketed downloading at home, added a virtual queue to keep visitors socially distanced, and added a virtual tour for “arm-chair” visitors to keep engaged.
With their intentional implementation of the app as a necessary component to a successful visitor experience, they have driven downloads to an impressively high rate even when capacity and attendance was lower than average.
Conclusion
As a muse-tech community, we have been waiting for the moment when audiences were ready to go full BYOD, to rid staff time and budget of device maintenance and operations. What we concluded given the data shown, is that there is in fact a symbiotic relationship between the evolved readiness of audiences to download apps, and museum’s interest in creating and marketing relevant apps. Museum teams across every department (not just digital) were willing to take risks, experiment with new app capabilities, and heavily market at-home digital experiences. This led to more relevant digital products that audiences were made more aware of. Additionally, audiences were more open-minded about museum apps, and a bit more conditioned to use their personal devices for interactions than they were in past. Overall, we see the impacts of the pandemic in the data, and we are confident that app take-up and use will continue in this favorable direction going forward.